

Overtrading? October's Busiest Week Lost Least | ELITE Tape
Overtrading isn't just a trade count. In October, the busiest full week for ELITE accounts lost the least, about half the loss per trade of mid-month.
Overtrading Isn't About the Trade Count

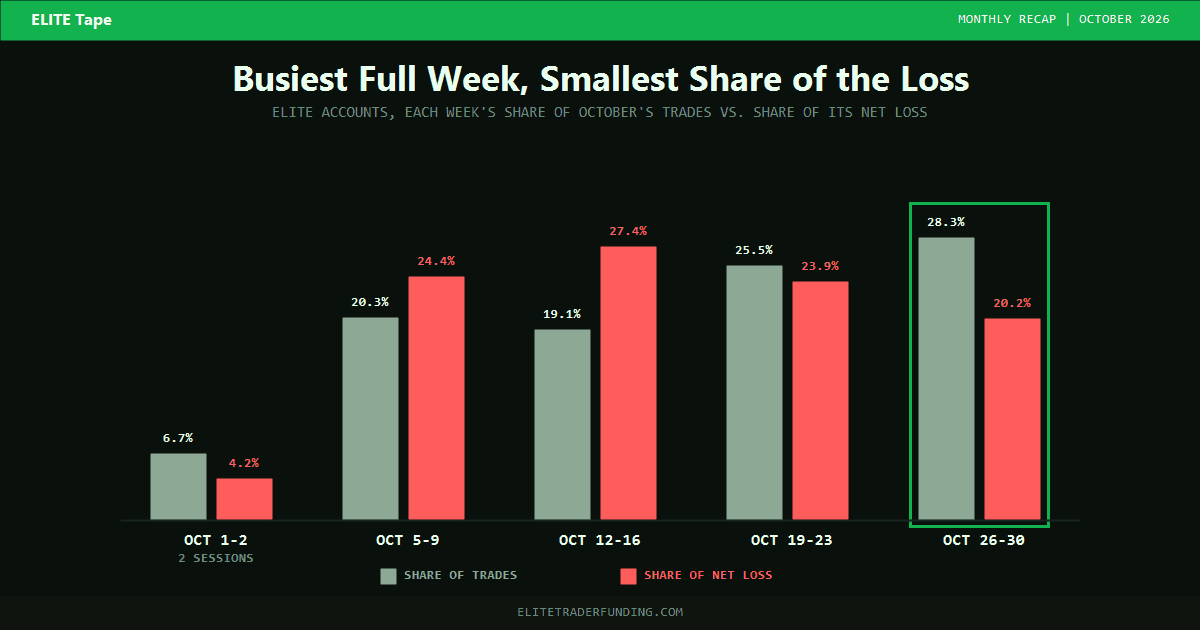
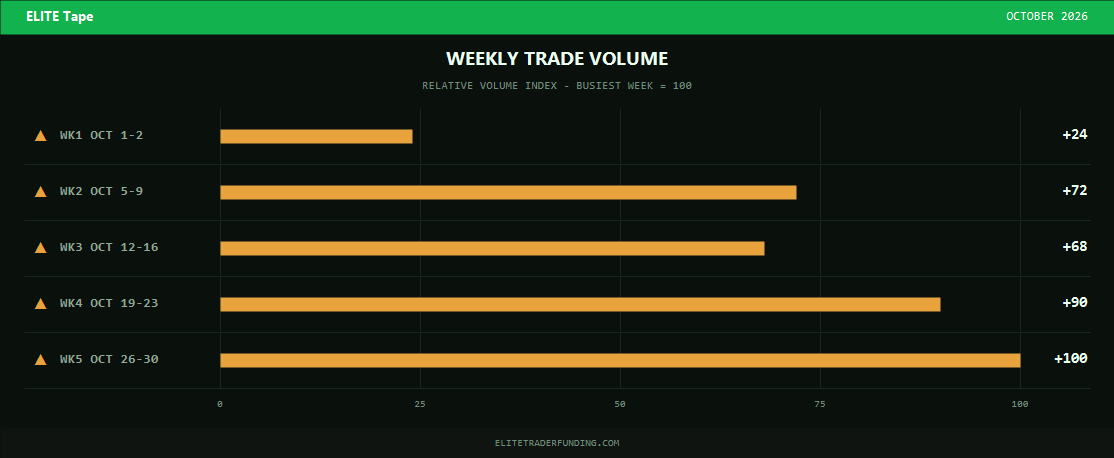
Overtrading is usually measured in trades per day, but October's ELITE data points somewhere else. Of the month's four full weeks, the busiest one, October 26-30, also posted the smallest loss, and each trade that week lost about half as much as a trade in the costliest week, October 12-16.
Elite Trader Funding (ETF) is a futures prop firm for traders who want uncapped LIVE ELITE withdrawals. October is a useful month for anyone who worries that more trades always mean more damage. The number that moved wasn't how often ELITE accounts traded. It was how much each trade cost.
Key Takeaways
- October 26-30, 2026 was the busiest week of the month for ELITE sim-funded accounts at Elite Trader Funding, with about 28% of October's trades but only about a fifth of its net loss.
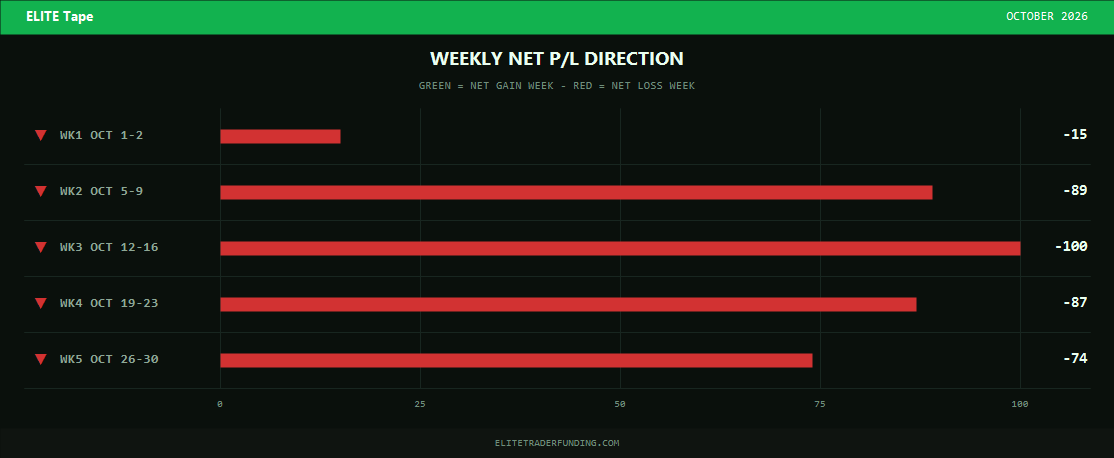
- October 12-16, 2026 was the costliest week for ELITE accounts, carrying more than a quarter of the month's net loss on about a fifth of its trades.
- Per trade, ELITE accounts lost about half as much in the last full week of October 2026 (October 26-30) as in the costliest week (October 12-16).
- Net loss per ELITE account at Elite Trader Funding was about a tenth lower in October 2026 than in September.
- Micro E-mini S&P 500 (MES) was the top profit instrument for ELITE accounts in October 2026, about three times Silver (SI) in second.
- Only 3 of the 22 weekday sessions in October 2026 finished green for ELITE accounts combined.
How we measured: these figures cover every closed trade in ELITE sim-funded accounts on Tradovate from October 1-31, 2026, counted on the day each trade closed, and are shown as shares and relative indexes rather than dollar amounts.
Below: where October's volume went, the short profit list, the loss column, and how the five weeks compared trade for trade.
The Nasdaq-100 Pair Carried Most of the Month's Volume
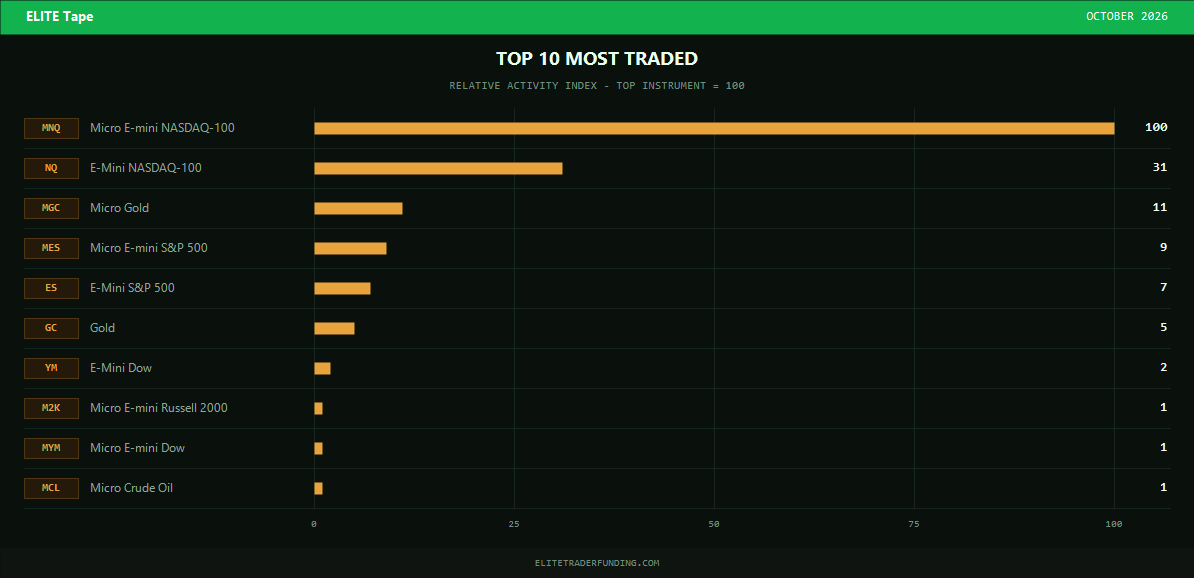
Micro E-mini NASDAQ-100 (MNQ) led October's volume by a wide margin, a little over three times E-Mini NASDAQ-100 (NQ) in second. Micro Gold (MGC) held third, ahead of Micro E-mini S&P 500 (MES), E-Mini S&P 500 (ES) and Gold (GC). E-Mini Dow (YM), Micro E-mini Russell 2000 (M2K), Micro E-mini Dow (MYM) and Micro Crude Oil (MCL) completed the top 10.
Together, MNQ and NQ made up a little under four of every five ELITE trades in October. For the full list of contracts ELITE accounts can trade, see ETF's What Instruments Can I Trade guide.
Micro S&P 500 Made About Three Times the Next Instrument
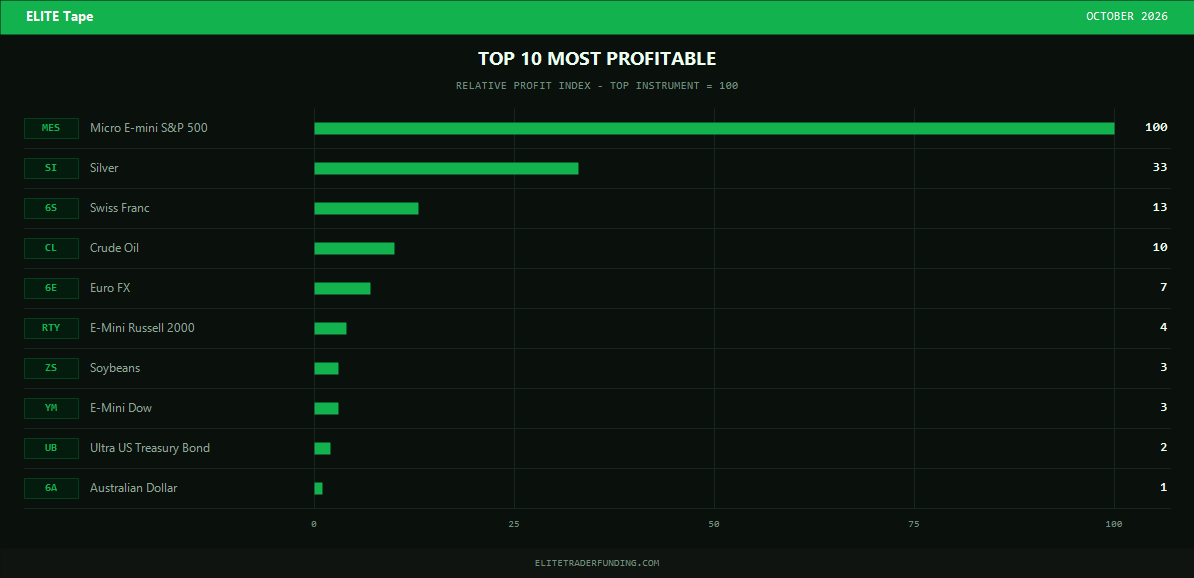
Micro E-mini S&P 500 (MES) topped October's profit list, about three times Silver (SI) in second. Swiss Franc (6S), Crude Oil (CL) and Euro FX (6E) came next, followed by E-Mini Russell 2000 (RTY), Soybeans (ZS), E-Mini Dow (YM), Ultra US Treasury Bond (UB) and Australian Dollar (6A).
The full-size E-Mini S&P 500 went the other way, finishing as October's third-largest loss instrument. Measured per micro-sized contract (ten micros per mini, the ratio ETF uses for position limits), MES made money while ES lost. The month's best result came from the micro contract, not its full-size version. ETF's Trade Expectancy Calculator shows how win rate and average win and loss size combine into what each trade is worth.
The Loss Column Followed the Volume
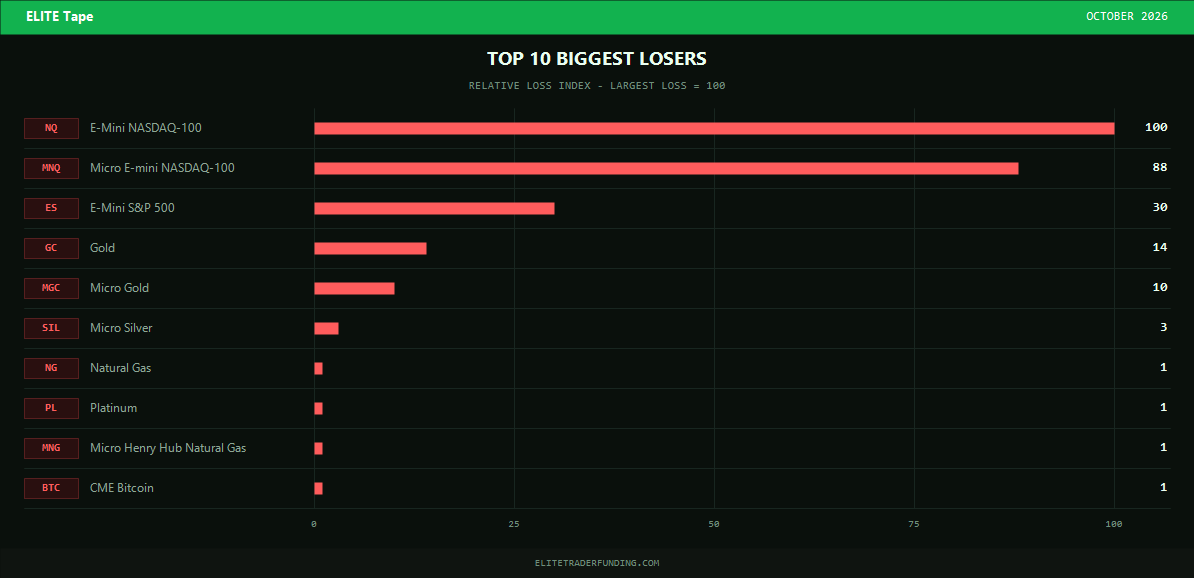
E-Mini NASDAQ-100 (NQ) was October's largest loss instrument, a little more than Micro E-mini NASDAQ-100 (MNQ) in second. E-Mini S&P 500 (ES) was third, then Gold (GC) and Micro Gold (MGC), followed by Micro Silver (SIL), Natural Gas (NG), Platinum (PL), Micro Henry Hub Natural Gas (MNG) and CME Bitcoin (BTC).
The Nasdaq-100 pair's share of the loss was almost exactly its share of the trades, a little under four of every five. Public market reporting shows the Nasdaq Composite fell 5.3% in October, its steepest monthly drop since March 2025, while the S&P 500 slipped 0.9% and the Dow rose 1.7%. Gold had a rough month too: spot gold fell 6.8% in October. That's verified market context for the same calendar month, not an explanation of ELITE results, which come down to each trader's own direction, size and timing.
Wondering whether you're overtrading or just trading too big? The answer is in what each trade is worth, not how many you take. Browse available evaluations, and if you want more than one account size or drawdown style, add each one to the cart and check out once.
More Trades in the Last Week, About Half the Loss Per Trade
Every week finished net negative, but not in proportion to how busy it was. The costliest week took more than its share of the loss, and the busiest week took less.
Week | Dates | Share of trades | Share of net loss | Loss per trade (costliest week = 100) |
|---|---|---|---|---|
Week 1 | Oct 1-2 (two sessions) | 6.7% | 4.2% | 44 |
Week 2 | Oct 5-9 | 20.3% | 24.4% | 84 |
Week 3 | Oct 12-16 | 19.1% | 27.4% | 100 |
Week 4 | Oct 19-23 | 25.5% | 23.9% | 65 |
Week 5 | Oct 26-30 | 28.3% | 20.2% | 50 |
Share of ELITE accounts' October 2026 trades and net loss by week. Every week finished net negative. Week 1 is the October end of a week that began September 28. Shares may not add to exactly 100% because of rounding.
Week 1 covered just two sessions; that week's full breakdown is in Mini Dow Futures: The Dow Fell, YM Led. Week 2 is in S&P 500 Futures: How MES Beat ES This Week.
Week 3 was the month's low point, the week of the September CPI report; see CPI Trading: Hot CPI Day Cost the Most. Week 4 held the single costliest session of October, Thursday the 22nd, when earnings pulled the Nasdaq lower; see Gold Price Drop: Shorts Gained, Longs Lost. Week 5, the busiest and the lightest full week, ran from an AI rally to the Fed decision and a Friday tech selloff; see Micro vs Mini Futures: Micros Came Out Ahead. The calendar events are listed as timing only, not as a cause.
The lesson for overtrading: a busy week isn't the problem on its own. What decides the damage is the size of the losing trades against the winners, and whether each extra trade has an edge behind it.
Patterns and What We're Watching
- Micro E-mini NASDAQ-100 (MNQ): the #1 monthly volume instrument in August, September and October.
- E-Mini NASDAQ-100 (NQ): the largest monthly loss instrument in August, September and October. In the weekly recaps, it hasn't left the loss column since we've been tracking this data.
- Micro E-mini S&P 500 (MES): October's top profit instrument. E-Mini Russell 2000 (RTY), August's and September's leader, dropped to sixth.
- Busiest week vs. costliest week: in September, the busiest week was also the costliest. In October, the busiest full week was the lightest.
- Loss per account: about a tenth lower in October than in September.
Ready to Trade November Without Overtrading?
Overtrading is less about how many trades you take and more about what each one risks. If you'd rather start with no evaluation at all, look at a Direct to Funded account (see how the DTF plan works), and use ETF's Active Trading Day rule as a check on quality: a day only counts when it clears a minimum profit and a share of your best day (see how Active Trading Days work). Want more than one account? Add several to the cart and buy them in a single checkout.
About ELITE Accounts at Elite Trader Funding
ELITE accounts are sim-funded. The figures in these recaps are position P/L from those accounts, not LIVE ELITE results. Traders reach an Elite Sim-Funded account either by passing an evaluation or by purchasing a Direct to Funded (DTF) account, which skips the evaluation step, and those who do well may progress to LIVE ELITE, ETF's real-capital program, where withdrawals are uncapped above your onboarding balance.
Related Articles
- E-Mini Russell 2000 Futures Led a Red September (last month, when the busiest week was also the costliest)
- Micro vs Mini Futures: Micros Came Out Ahead (October's last week in detail)
- CPI Trading: Hot CPI Day Cost the Most (the month's heaviest week)
Elite Trader Funding offers evaluation paths for every stage on the way to uncapped LIVE ELITE withdrawals, whether you trade a few times a week or many times a day, and whether you're working on overtrading or on sizing. Evaluations are available for every account size. Real trader results, community feedback, and program details are available through ETF's testimonials, Elite Points program, affiliate program, and trading competitions.
Accuracy note: Figures in this recap are aggregated position P/L across ELITE accounts for October 1-31, 2026, shown as relative indexes, shares and directions. They are not any individual trader's results. ELITE accounts on Tradovate are covered; a small number of ELITE accounts on other platforms are not included.
Risk Disclosure: ELITE accounts operate in a simulated trading environment. Futures trading involves substantial risk of loss, and past performance of simulated accounts is not indicative of future results.
Pricing and Product Disclaimer: Pricing, promotions, and product details referenced in this article reflect information available at the time of publication and may have changed. Visit the evaluations page for current pricing.