

S&P 500 Futures: How MES Beat ES This Week | ELITE Tape
Trading S&P 500 futures? Micro MES stayed green all five days for ELITE accounts while full-size ES was red on four. Here's what contract size changed.
S&P 500 Futures: Micro Green All Week, ES Red

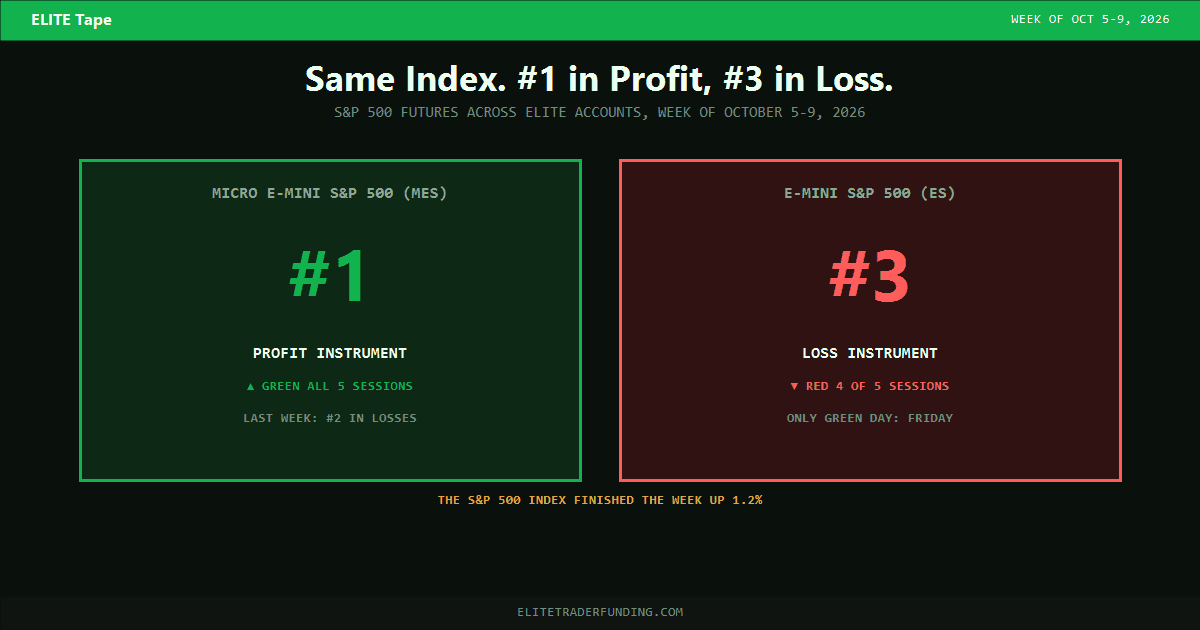
The S&P 500 hit a record this week, and S&P 500 futures still split in two across ELITE accounts: Micro E-mini S&P 500 (MES) finished green on all five sessions and topped the profit list, while E-Mini S&P 500 (ES) was red on four of five and placed third in losses.
ETF is a futures prop firm for traders who want uncapped LIVE ELITE payouts, and this week is a clean example of why the contract you pick can matter as much as the market you pick. Same index, same five days, opposite results. MES was green on the up days that opened the week and on the two down days that followed. ES was red on both kinds.
Key Takeaways
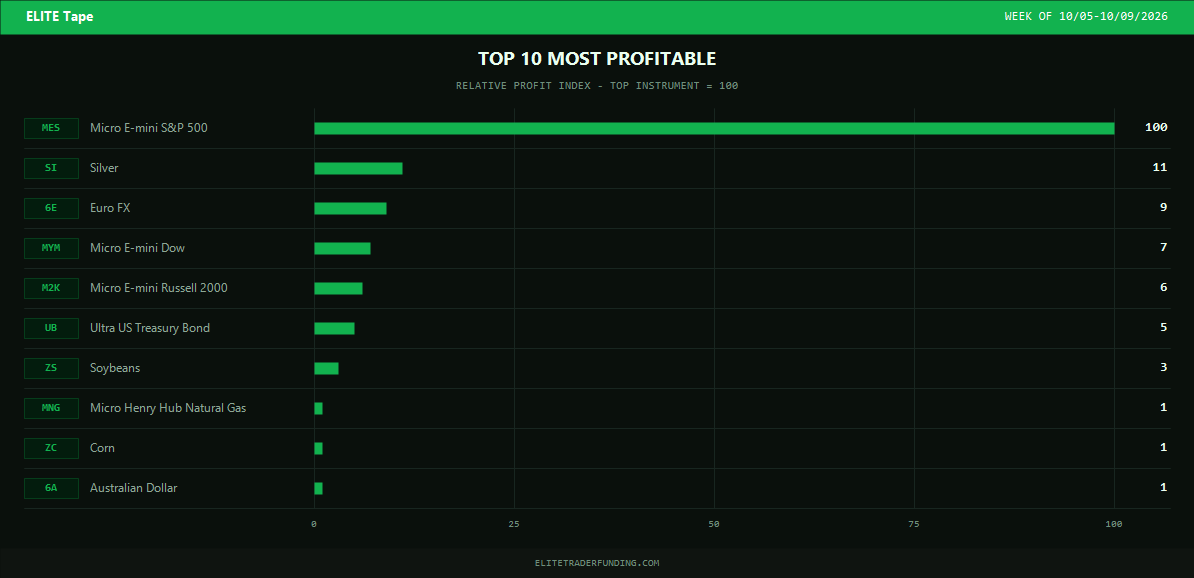
- Micro E-mini S&P 500 (MES) was the #1 profit instrument for ELITE accounts, more than nine times Silver's (SI) total.
- MES finished green every session, Monday through Friday. E-Mini S&P 500 (ES), its full-size sibling, was red Monday through Thursday and green only on Friday.
- One week earlier, MES was second in the loss column. This week it topped the profit list.
- Micro E-mini NASDAQ-100 (MNQ) and E-Mini NASDAQ-100 (NQ) led the loss column, and the week closed net negative across ELITE accounts, with Thursday the heaviest session.
- For a trader, the lesson is about size: an MES contract is one-tenth of an ES contract, so the same read on the S&P 500 puts far less on the line per point.
Below: where ELITE volume went, how the S&P pair split, where the losses landed, and how each day lined up with the real market.
The NASDAQ Pair Took the Volume, the S&P Pair Split It Evenly
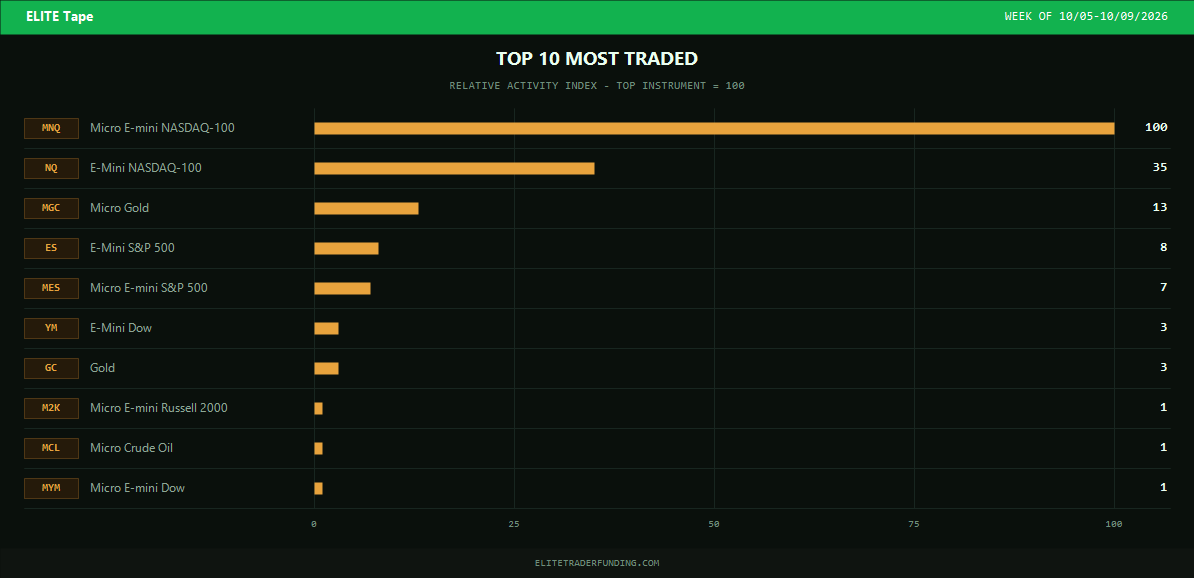
Micro E-mini NASDAQ-100 (MNQ) led ELITE trading volume again, nearly three times the activity of E-Mini NASDAQ-100 (NQ) in second. Together the NASDAQ-100 pair carried nearly four of every five ELITE trades. Micro Gold (MGC) was third, then E-Mini S&P 500 (ES) and Micro E-mini S&P 500 (MES), close to level with each other. E-Mini Dow (YM), Gold (GC), Micro E-mini Russell 2000 (M2K), Micro Crude Oil (MCL), and Micro E-mini Dow (MYM) completed the top 10.
That near-even split between ES and MES is the setup for this week's story. The two contracts saw a similar amount of trading, but each ES contract is ten times the size of an MES contract, so the full-size side carried far more exposure to every point the index moved. For the limits on each account type, see ETF's contract limits guide, which sets separate ceilings for minis and micros (on most evaluation types the micro ceiling is ten times the mini ceiling, and the two are not meant to be stacked).
How Micro S&P 500 Futures Stayed Green Through Records and Dips
Micro E-mini S&P 500 (MES), the contract most traders call micro S&P 500 futures, topped the profit list by a wide margin. Silver (SI) was second, Euro FX (6E) third, then Micro E-mini Dow (MYM), Micro E-mini Russell 2000 (M2K), and Ultra US Treasury Bond (UB). Soybeans (ZS), Micro Henry Hub Natural Gas (MNG), Corn (ZC), and Australian Dollar (6A) rounded out the top 10.
MES was green on every session. That includes Monday and Tuesday, when the S&P 500 rose (closing at a record on Tuesday), and Wednesday and Thursday, when it slipped. About half of the ELITE accounts that traded MES finished the week positive.
One week earlier, MES sat second in the loss column. For the last time the S&P pair split along size lines, in the opposite direction, see ES vs MES Futures: Full-Size Wins, Micro Loses. The micros don't always come out ahead. This week they did.
Where the NASDAQ Pair and Full-Size S&P Gave It Back
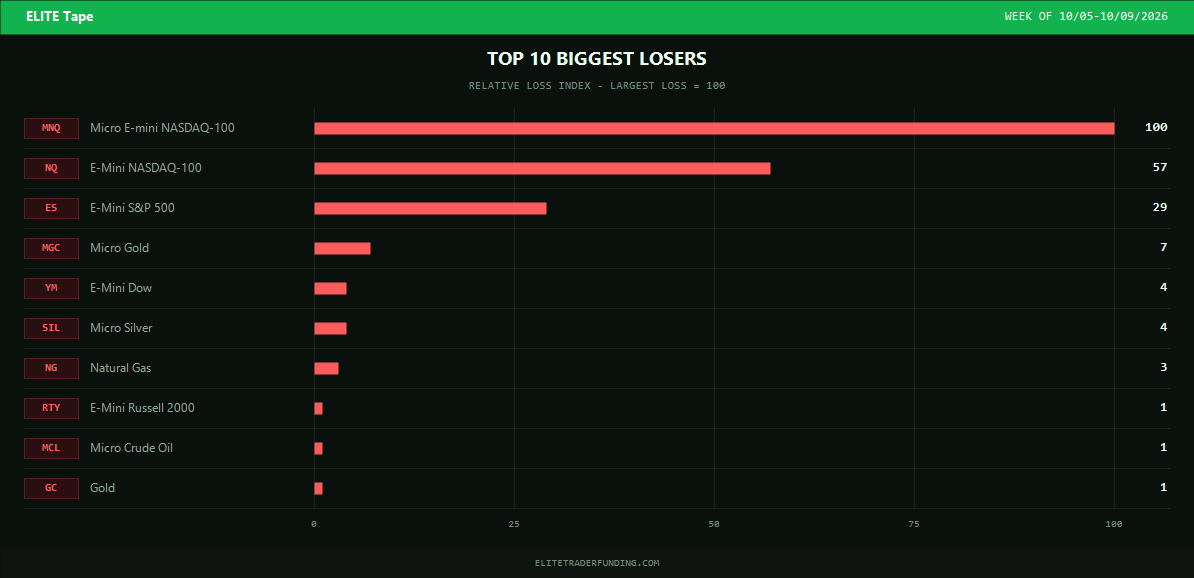
Micro E-mini NASDAQ-100 (MNQ) led every instrument in losses, about one and three-quarter times E-Mini NASDAQ-100 (NQ) in second. E-Mini S&P 500 (ES) was third, followed by Micro Gold (MGC), E-Mini Dow (YM), and Micro Silver (SIL). Natural Gas (NG), E-Mini Russell 2000 (RTY), Micro Crude Oil (MCL), and Gold (GC) completed the top 10 loss instruments.
ES finished red on Monday, Tuesday, Wednesday, and Thursday before a green Friday. ETF's Position Size Calculator shows how much a stop distance costs at each contract size before you place the trade.
Would you rather trade the micro or the full-size contract? Browse available evaluations and choose the account size and drawdown style that fit the contracts you trade.
Records Early, a Tech Slide Late, and Two Green Sessions
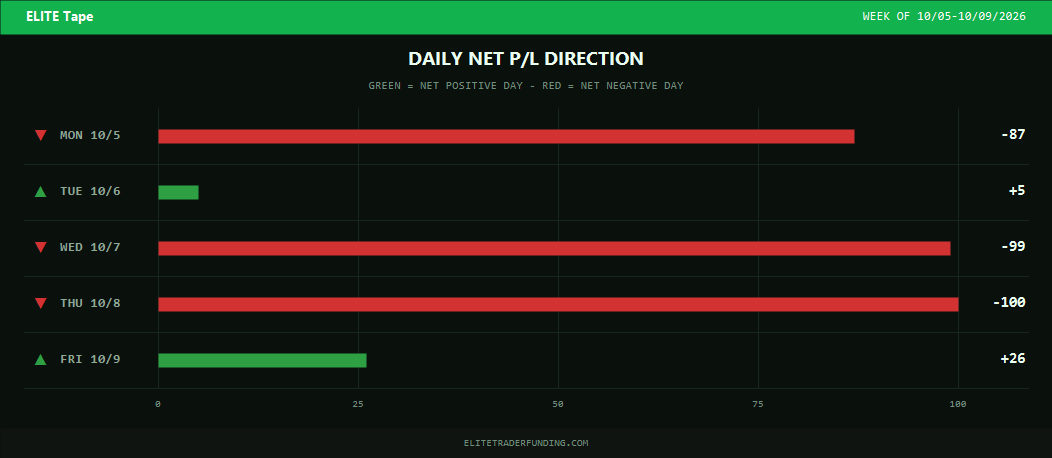
Tuesday and Friday closed green for ELITE accounts. Monday, Wednesday, and Thursday closed red, and Wednesday and Thursday together made up most of the losing-day total.
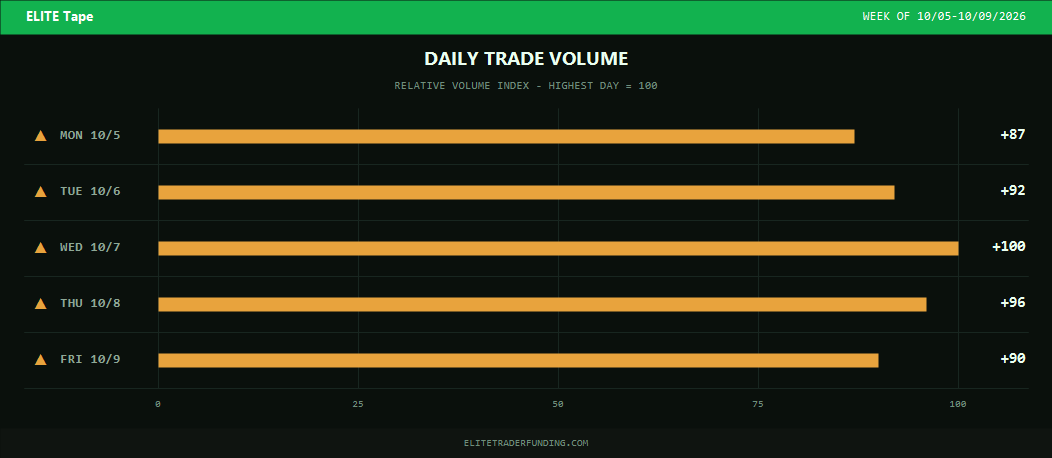
- Mon 10/5: Relative volume lowest of the week - Net Loss (3rd Heaviest)
- Tue 10/6: Relative volume middle of the week - Net Profit (Smaller Gain)
- Wed 10/7: Relative volume highest of the week - Net Loss (2nd Heaviest)
- Thu 10/8: Relative volume 2nd highest of the week - Net Loss (Heaviest)
- Fri 10/9: Relative volume 2nd lowest of the week - Net Profit (Larger Gain)
Public market reporting shows a week that started at records and ended higher. Monday, the S&P 500 and Dow rose and the Nasdaq Composite closed at a record as AI-tied stocks gained. Tuesday, the S&P 500 and Nasdaq both closed at records. Wednesday, stocks pulled back, with the S&P 500 down 0.2% and the Dow down 0.7%, and the 10-year Treasury yield held near its highest level since 2002. CME Group's Active Trader account noted that morning that the 10-year yield had climbed from 3.98% in early March to 5.32% by early October. Thursday, an AI and chip-stock selloff sent the Nasdaq down 1.3% and the S&P 500 down 0.5% while oil rose. Chip stocks led the drop following reports about OpenAI's revenue outlook, and weekly jobless claims came in at 197,000, just under the 200,000 forecast. Friday, stocks rebounded as oil and yields steadied, and the S&P 500 finished the week up 1.2%.
Put that next to the S&P pair. MES was green on the two up days that opened the week, green on the two down days, and green on Friday's rebound. ES was red on the up days and the down days alike, and its only green session was Friday. None of this is presented as a cause of ELITE accounts' results, only as verified market context for the same calendar days.
Why the Two Busiest Sessions Were Also the Costliest
Wednesday carried the heaviest ELITE volume of the week and Thursday the second heaviest, and those were the two costliest sessions, nearly level with each other. Monday, the quietest session, was still red. Friday, the second-quietest, was the best day of the week. When the tape is busy it can feel like the time to press, and this week the busiest sessions were the ones that cost the most.
MES stayed green through all of it, on the quiet days and the busy ones.
Pattern Section
Streaks and frequency data we're watching:
- Micro E-mini S&P 500 (MES): first in profit, one week after placing second in the loss column.
- NQ (E-Mini NASDAQ-100): second in losses this week behind MNQ, and still a fixture of the loss column since we've been tracking this data.
- MNQ (Micro E-mini NASDAQ-100) and ES (E-Mini S&P 500): each a top-10 loss instrument for an 11th straight week.
- Gold (GC): a top-10 loss instrument for a 5th straight week.
- Euro FX (6E): a top-10 profit performer for a 5th straight week, and Micro E-mini Russell 2000 (M2K) for a 3rd.
- Micro Henry Hub Natural Gas (MNG): made the profit list for the first time in the last six weeks.
Ready to Pick the Contract Size That Fits Your Plan?
Same index, same week, two very different results. The week ahead brings the September Consumer Price Index on Wednesday and the Producer Price Index on Thursday, so plan your size before the numbers hit. Start with a 1-Step evaluation, which you can pass in as few as five trading days (see how the 1-Step plan works). Want more than one account size or drawdown style? Add several evaluations to the cart and check out once.
About ELITE Accounts at Elite Trader Funding
ELITE accounts are sim-funded. The figures in these recaps are position P/L from those accounts, not LIVE ELITE results. Traders reach an Elite Sim-Funded account either by passing an evaluation or by purchasing a Direct to Funded (DTF) account, which skips the evaluation step, and those who do well may progress to LIVE ELITE, ETF's real-capital program, where there is no cap on payouts.
Related Articles
- Mini Dow Futures: The Dow Fell, YM Led (last week, when the Dow complex finished first)
- E-Mini Russell 2000 Futures Led a Red September (the full September recap)
- ES vs MES Futures: Full-Size Wins, Micro Loses (the S&P pair's last size split, the other way around)
Elite Trader Funding offers evaluation paths for every stage on the way to uncapped LIVE ELITE payouts, whether you trade S&P 500 futures at full size, the micro contract, or any other supported market. Evaluations are available for every account size. Real trader results, community feedback, and program details are available through ETF's testimonials, Elite Points program, affiliate program, and trading competitions.
Accuracy note: Figures in this recap are aggregated position P/L across ELITE accounts for October 5 to October 9, 2026, shown as relative indexes and directions. They are not any individual trader's results.
Risk Disclosure: ELITE accounts operate in a simulated trading environment. Futures trading involves substantial risk of loss, and past performance of simulated accounts is not indicative of future results.
Pricing and Product Disclaimer: Pricing, promotions, and product details referenced in this article reflect information available at the time of publication and may have changed. Visit the evaluations page for current pricing.