ELITE Tape | MNQ vs NQ Futures: Five Days, No Green, and Friday Was the Whole Story.
MNQ led ELITE volume, NQ led losses again. Five sessions, all red, with Friday accounting for more damage than Monday through Thursday combined. Full recap.
Week in Context

MNQ vs NQ played out exactly as it has for weeks: MNQ led all ELITE trading volume, NQ led all losses. Five sessions, five losses, and a Friday that hit harder than the other four days combined.
ETF is a futures prop firm for traders who want uncapped Live Elite payouts. Each week, ELITE account data shows what traders in sim-funded ELITE accounts are actually doing and how those positions resolved. This is the full recap for June 1-5, 2026.
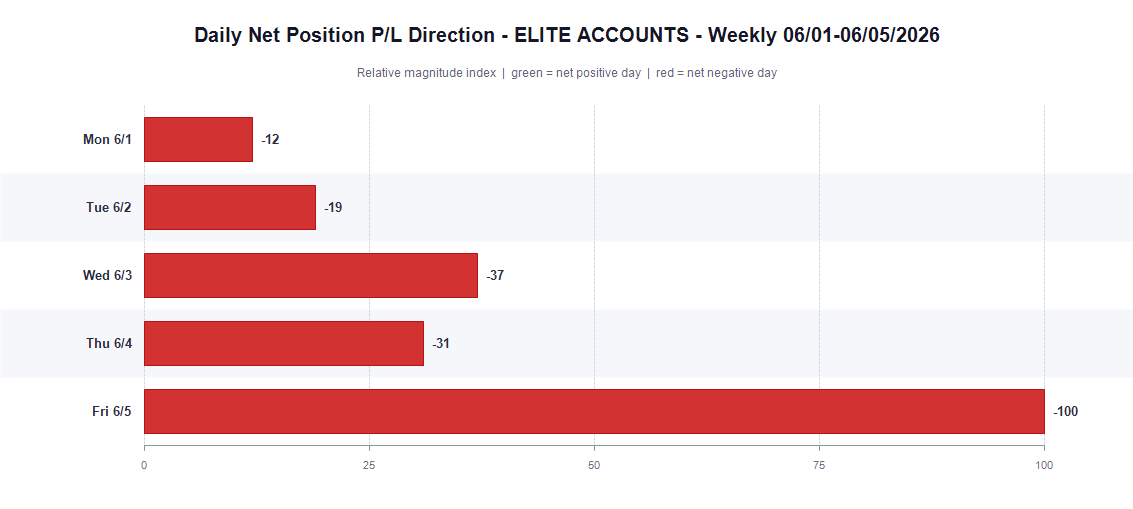
Monday opened quietly. Losses were real but relatively contained. Tuesday nudged higher. Wednesday escalated. Thursday pulled back a bit from Wednesday's pace. And then Friday happened.
The final session of the week generated more losses than Monday, Tuesday, Wednesday, and Thursday combined. Friday owned more than half the week's total damage in a single session.
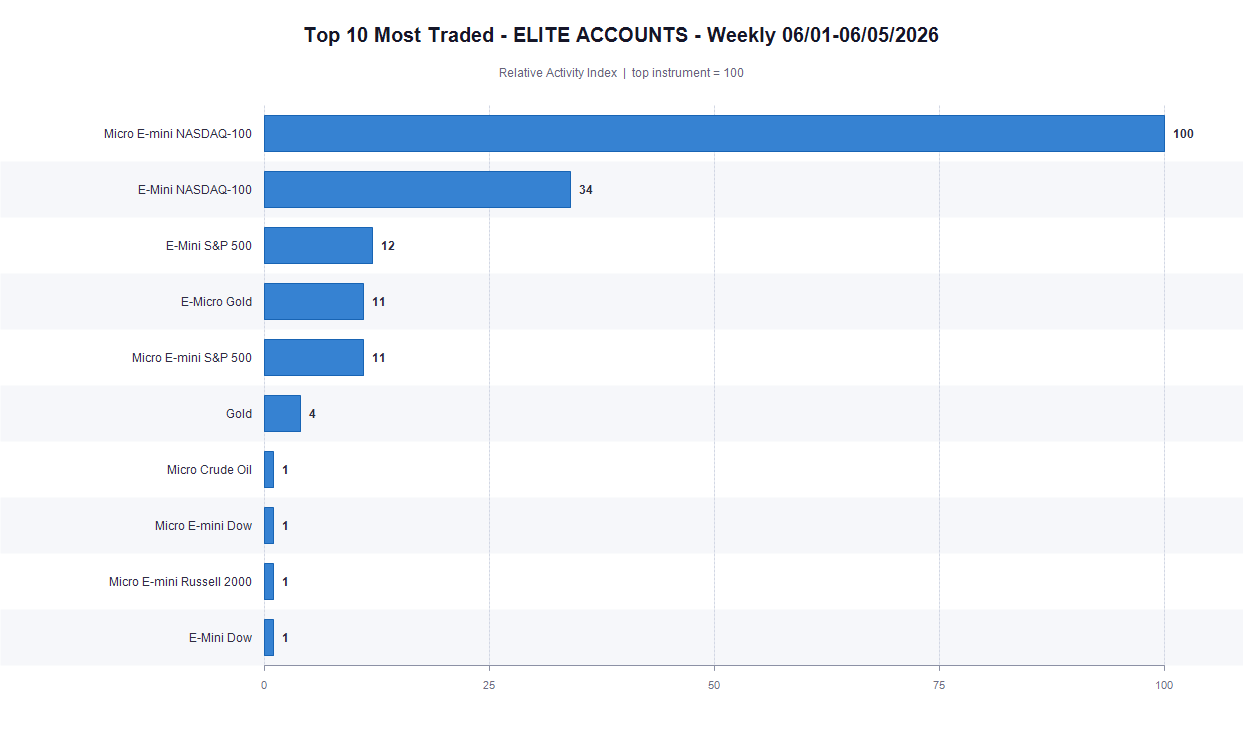
MNQ held the top spot on volume. That is now the seventh consecutive week MNQ has led ELITE trading activity. NQ sat second. The NASDAQ-family contracts together made up the majority of all trading across ELITE accounts. That part has not changed. What changed this week was the scale of the damage attached to those positions.
Where the Activity Was
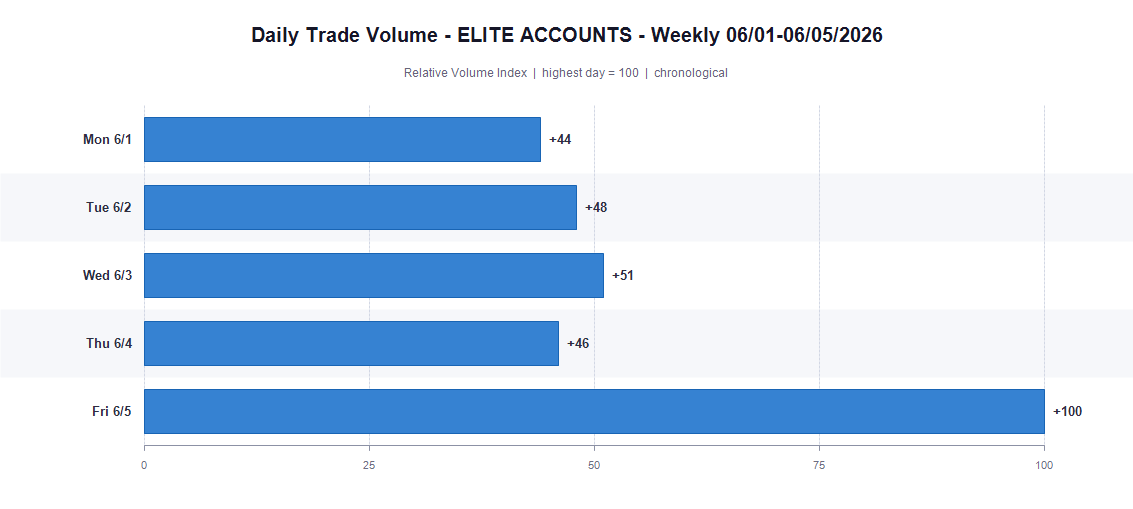
The daily volume chart tells the story plainly. Friday's activity was nearly double any other session this week. Not a modest step up. Almost twice the volume of the next closest day.
And the P/L chart makes it worse. Friday's losses were not just the largest of the week. They were larger than the combined losses of Monday, Tuesday, Wednesday, and Thursday. One session. More than half the week's total damage.
The week built toward Friday without announcing it. Volume was relatively steady from Monday through Thursday, activity dipped a bit on Thursday, and then Friday erupted. Traders who made it through the first four days with manageable drawdowns ran straight into a session that erased the buffer entirely.
Where the Pain Was
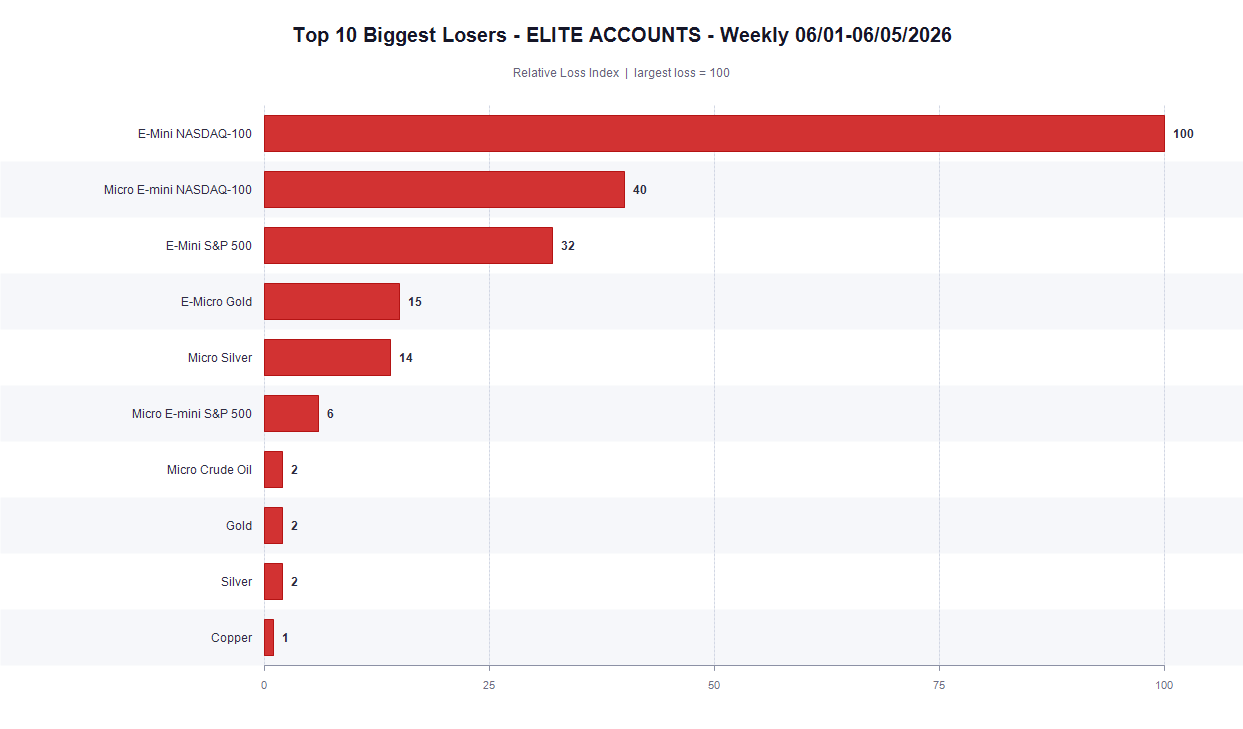
NQ was the biggest loser. By a long way. This is the seventh consecutive week NQ has held that position.
NQ alone absorbed close to half of the entire week's position losses. MNQ came in second and it was not even in the same territory. Add them together and the NASDAQ complex, NQ and MNQ combined, accounts for the majority of all ELITE losses this week. Same instruments, same column, same story.
E-Mini S&P 500 finished in the red for the third week in a row. ES has now joined NQ and E-Micro Gold as a consistent-loss instrument in this data.
Micro Silver appeared near the top of the loser column this week with a significant hit. The broader metals complex had a rough week: E-Micro Gold, Micro Silver, Gold, and Silver all closed negative. Micro E-mini S&P 500 and Micro Crude Oil also landed on the loss side.
Where It Worked
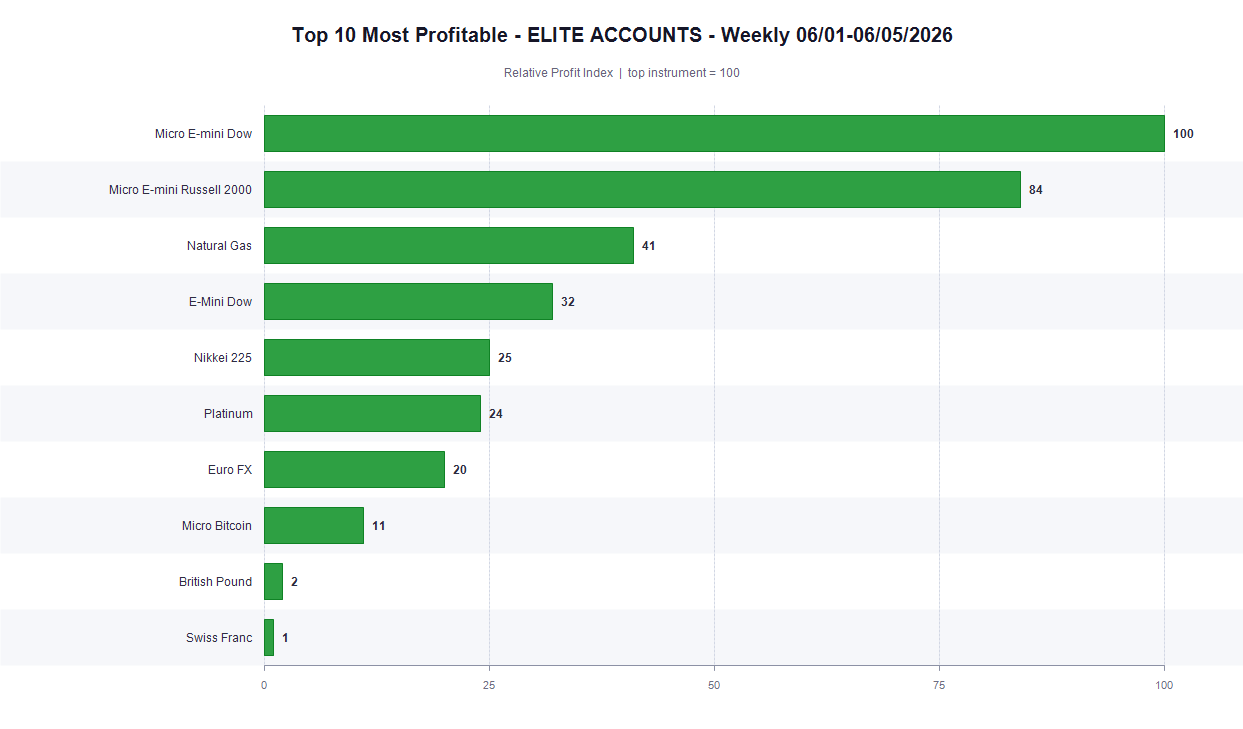
The profitable side was thin but present. Micro E-mini Dow and Micro E-mini Russell 2000 both finished positive. Natural Gas kept its streak alive for the sixth consecutive week.
Nikkei 225 posted a gain for the third week in a row. Platinum and Euro FX were both positive. These were not outsized results relative to what the loss side was doing. But they held direction when most of the market did not.
The NASDAQ bled. The Dow and Russell micros didn't. MYM and M2K both finished positive while MNQ and NQ led all losses. Same week, completely different markets.
Day by Day
When you pass your evaluation at Elite Trader Funding, you are placed into a sim-funded ELITE account. The data in this recap comes directly from those accounts. Traders who perform well enough, and catch the attention of the ETF team, earn the chance to move to Live Elite: ETF's real-capital program with no payout cap.
The weekly recap exists because the patterns matter. A bad Friday is a data point. Six weeks of NQ in the same column is a pattern. Knowing the difference, and knowing which instruments keep showing up in which categories, is part of how you trade with actual context behind your decisions.
The Pattern
NQ has been in the loss column every single week for seven straight weeks. Not some of those weeks. All seven. The size of the loss varies. Some weeks are worse than others. But NQ keeps landing in the same place, and this week was the worst single week in the entire lookback window.
E-Micro Gold has done the same. Seven consecutive weeks in the top loser column. This week was above the seven-week average loss for that instrument.
Natural Gas has been on the profitable side every single week for the same six-week stretch. Small, consistent, and the only instrument with a perfect record on the positive side.
ES is now three consecutive weeks as a top loser. MNQ the same. Three weeks in a row. The NASDAQ complex as a whole has not had a clean week in over a month.
Friday added a new data point: the biggest single-session loss day in recent weeks by a substantial margin. Six weeks of the same directional patterns, and now a Friday that may be the most costly session in the entire lookback window. Was everybody trying to buy the dip?